Same House, Eight Climates: How HVAC Load Changes by Climate Zone
By Danish Javaid, founder & editor · Published · Updated
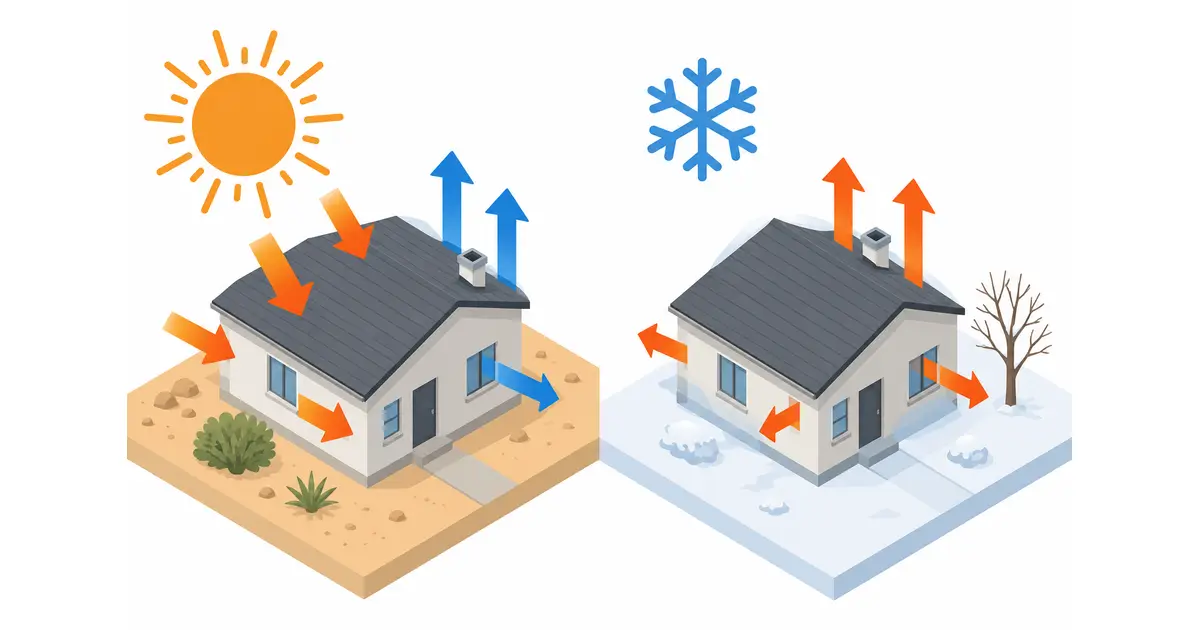
One 2,000 ft² house, moved through all eight IECC climate zones, goes from a 5.9-ton cooling load and a 36,000 BTU/h heating load in Zone 1 to a 2.6-ton cooling load and a 130,000 BTU/h heating load in Zone 8. We got those figures by running this site's own homepage calculation on one fixed set of inputs and changing only the zone. Below are every number, what drives the swing, how a screening profile compares with a published Manual J result, and what it means for choosing a heat pump or furnace.
The house and the method
The HVAC load calculator is a per-area screen: each climate zone has a cooling rate and a heating rate in BTU/h per ft², adjusted for insulation, sun, ceiling height, occupants, window count, and home type. A Manual J report works surface by surface with local weather and will not reproduce these figures; the screen is useful for seeing how strongly climate alone moves a load. The inputs were identical in every run:
| Input | Value used |
|---|---|
| Conditioned area, ceiling | 2,000 ft², 8 ft |
| Home type, windows | Single-story house, 12 windows |
| Insulation, sun | Average (typical 2×4 walls, R-13), average exposure |
| Occupants | 4 |
| Climate zone | 1 through 8, one run each |
Results across Zones 1 to 8
| Zone | Cooling load | Cooling tons | Heating load | Furnace output target | Heating ÷ cooling |
|---|---|---|---|---|---|
| 1 (Miami, Honolulu) | 71,200 BTU/h | 5.93, shown as 6 | 36,000 BTU/h | 45,000 BTU/h | 0.51 |
| 2 (Houston, Phoenix) | 65,200 BTU/h | 5.43, shown as 5.5 | 44,000 BTU/h | 55,000 BTU/h | 0.67 |
| 3 (Atlanta, Dallas) | 57,200 BTU/h | 4.77, shown as 5 | 56,000 BTU/h | 65,000 BTU/h | 0.98 |
| 4 (DC, Nashville) | 51,200 BTU/h | 4.27, shown as 4.5 | 70,000 BTU/h | 85,000 BTU/h | 1.37 |
| 5 (Chicago, Denver) | 45,200 BTU/h | 3.77, shown as 4 | 84,000 BTU/h | 100,000 BTU/h | 1.86 |
| 6 (Minneapolis) | 41,200 BTU/h | 3.43, shown as 3.5 | 100,000 BTU/h | 115,000 BTU/h | 2.43 |
| 7 (Duluth, Fargo) | 37,200 BTU/h | 3.10, shown as 3 | 116,000 BTU/h | 135,000 BTU/h | 3.12 |
| 8 (subarctic, Fairbanks ZIP) | 31,200 BTU/h | 2.60, shown as 2.5 | 130,000 BTU/h | 150,000 BTU/h | 4.17 |
Cooling falls by 40,000 BTU/h from Zone 1 to Zone 8, a factor of 2.3. Heating rises by 94,000 BTU/h, a factor of 3.6. The curves cross near Zone 3, where cooling is 57,200 and heating is 56,000. Zone 5 shows the arithmetic: cooling is 2,000 × 22 × 1.0 × 1.0 = 44,000 plus 1,200 for occupants, 45,200 BTU/h; heating is 2,000 × 42 = 84,000; the furnace target is 84,000 × 1.15 = 96,600, rounded up to 100,000.
Why heating swings more than cooling
| Zone | Cooling design temp | Heating design temp | Winter ΔT from 70°F | Cooling rate | Heating rate |
|---|---|---|---|---|---|
| 1 | 92°F | 50°F | 20°F | 35 BTU/h per ft² | 18 |
| 2 | 95°F | 35°F | 35°F | 32 | 22 |
| 3 | 93°F | 28°F | 42°F | 28 | 28 |
| 4 | 90°F | 18°F | 52°F | 25 | 35 |
| 5 | 88°F | 5°F | 65°F | 22 | 42 |
| 6 | 85°F | −5°F | 75°F | 20 | 50 |
| 7 | 82°F | −15°F | 85°F | 18 | 58 |
| 8 | 78°F | −30°F | 100°F | 15 | 65 |
- Heating follows temperature difference. The winter gap grows from 20°F to 100°F across the zones, a factor of five, while the summer design temperature only moves between 78°F and 95°F.
- Fixed gains do not scale. The 1,200 BTU/h occupant allowance is the same everywhere: 1.7% of the Zone 1 cooling load and 3.8% of Zone 8.
- Zone 1 above Zone 2 is a property of the rate table. The method does not itemize humidity, so Zone 1's higher rate (35 versus 32) is an input assumption, not a physical result.
Same house, Zone 5, four insulation levels
| Insulation | Factor | Cooling load | Cooling tons | Heating load | Furnace output target |
|---|---|---|---|---|---|
| Poor | 1.25 | 56,200 BTU/h | 4.68, shown as 4.5 | 105,000 BTU/h | 125,000 BTU/h |
| Average (R-13 walls) | 1.00 | 45,200 BTU/h | 3.77, shown as 4 | 84,000 BTU/h | 100,000 BTU/h |
| Good (R-19 walls, R-38 attic) | 0.85 | 38,600 BTU/h | 3.22, shown as 3.5 | 71,400 BTU/h | 85,000 BTU/h |
| Excellent (R-21+ walls, R-49+ attic) | 0.70 | 32,000 BTU/h | 2.67, shown as 3 | 58,800 BTU/h | 70,000 BTU/h |
Poor to excellent cuts cooling by 24,200 BTU/h (43%) and heating by 46,200 BTU/h (44%). Average to excellent alone is 13,200 BTU/h of cooling, more than a ton, so air sealing and insulation belong before equipment sizing. Heating stays near 1.85 times cooling in every row because the factor scales both: insulation changes how large the system is, and climate decides which season governs.
How a screening profile compares with a published Manual J result
The DOE Building America sizing guide publishes Manual J loads for two one-story, 2,223 ft² houses built to the 2009 IECC. Putting them next to this tool's average-insulation rates shows how conservative the screen is:
| DOE Manual J, per ft² | This site's zone rate, average insulation | Ratio | |
|---|---|---|---|
| Orlando, cooling | 20,690 ÷ 2,223 = 9.3 BTU/h | Zone 2: 32 | 3.4× |
| Orlando, heating | 23,640 ÷ 2,223 = 10.6 | Zone 2: 22 | 2.1× |
| Chicago, cooling | 20,610 ÷ 2,223 = 9.3 | Zone 5: 22 | 2.4× |
| Chicago, heating | 41,660 ÷ 2,223 = 18.7 | Zone 5: 42 | 2.2× |
A screening result two to three times a modeled new house is expected for an average existing home, and it is also why the Zone 1 and 2 cooling loads here (5.4 to 5.9 tons for 2,000 ft²) should send you to check windows, ducts, and shading before accepting a figure near 6 tons. The AC sizing guide covers those checks.
What the pattern means for equipment
| Zones | Heating ÷ cooling | What governs | What to check |
|---|---|---|---|
| 1 and 2 | 0.51 to 0.67 | Cooling sets the size | A heat pump sized for cooling has ample nominal heating; the work is humidity control and not oversizing |
| 3 | 0.98 | Balanced | The model's output at local design temperatures decides |
| 4 and 5 | 1.37 to 1.86 | Heating starts to govern | A heat pump matched to the Zone 5 4-ton cooling load has 48,000 BTU/h nominal, 57% of the 84,000 heating load even at rated output; cold-climate models, backup heat, or dual fuel enter here |
| 6 to 8 | 2.43 to 4.17 | Heating sizes the system | Furnace output target is 115,000 to 150,000 BTU/h; at 96% AFUE, 115,000 output is 115,000 ÷ 0.96 ≈ 119,800 input |
Read the heat pump sizing guide for capacity curves, heat pump versus furnace for the trade-offs, and the furnace sizing guide for output versus input. The design temperature guide and the IECC zone guide explain why a house in the middle of Zone 5 and one at its colder edge share a label and still see different design days.
Limits of these numbers
- Each zone is one profile. Chicago and Denver share Zone 5 with different design temperatures and humidity.
- The method has no separate latent load, window orientation, or duct loss, so it cannot show how a humid climate changes coil selection.
- Equipment is chosen by comparing delivered capacity at design conditions with a documented load; a table like this does not replace that step.
Use your own inputs in the homepage calculator for a screen, or the component-based Manual J calculator to see how U-factors, glass, and leakage change the result.
Sources: DOE Building America, Strategy Guideline: HVAC Equipment Sizing (Chicago and Orlando house loads); ACCA Manual J.
Calculation guidance is reviewed against our published methodology. To report an error or request a correction, use the contact page.
Written and maintained by Danish Javaid, founder & editor. About this site.
Revision history
- : Tightened the data-driven comparison, removed FAQ filler, and added a comparison against published DOE Manual J loads.
- : First published: one 2,000 sq ft house run through Zones 1 to 8 with this site's calculator, plus a Zone 5 insulation comparison.